How to Trade Seasonal Futures Price Moves
Commodity markets follow strong and consistent seasonal price trends. There are certain times of the year when futures prices tend to go up, and there are other times of the year when future prices tend to drop.
Today, we'll talk about why these consistently strong seasonal trends exist, the different ways that you can analyze these trends, and the most consistently profitable approach for trading these trends.
Let's start by reviewing what seasonality is.

Seasonality is an extremely important concept to understand to successfully trade commodity markets. At Peak Trading Research, we talk a lot about the four most important non-fundamental drivers for commodity prices:
Macro economic environment
Month (aka seasonals)
Market Structure
Momentum
Knowing if it's a seasonally bullish month or a seasonally bearish month is a critically important part of your successful commodity trading game plan.
Seasonality is important, but how should we think about how seasonality works?
When commodity prices tend to rise during a certain time of the year, why is that?
Seasonals tend to generally follow production trends throughout a calendar year.
Traders tend to add what's called a ‘risk premium’ to futures prices during critical production months, and then price out that risk premium once production becomes more known.

To take an example for a market like U.S. Soybeans, traders tend to get nervous in April and May as we're heading into critical summer production months for Soybeans.
But by the time we get to June and July and August, that window where things can really go wrong starts closing and traders start to remove that price risk premium that they had added in April and May.
Soybean futures prices tend to drop in late summer.
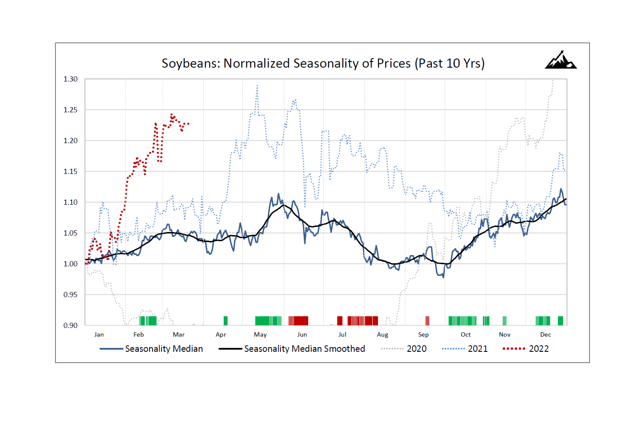


Every year is different and every year has a different mix of fundamental and non-fundamental price drivers that move prices, but if we take 10+ years of data we can get a sense for the big picture seasonal trends in futures prices throughout the calendar year.
At Peak Trading Research, we provide our clients with 10-year normalized price trends for every major commodity market (like we looked at for soybeans earlier).
We also provide our clients with heat maps to see the multi-week seasonal trends across the whole commodity complex.
And finally, we provide our clients with very specific high hit rate seasonal patterns every month.
For example, if we look at our March 2022 seasonal price patterns, we can see that Sugar No. 11 futures have dropped in 15 out of 17 years for the 27 trading sessions starting March 2nd.
That has been a consistently profitable bearish price trend in Sugar over the past 17 years.
You can also analyze seasonal trends yourself using Excel or Python, or even an automated trading platform like MultiCharts or TradeStation.
For example, if you would use a simple script like this in TradeStation, you could test when the best time of the year is to enter a trade and also optimize to find how long you should stay in that trade.

We can see using that code that TradeStation is telling us what we already knew: that is selling in early March and covering that short in May is generally a profitable approach.
Seasonal code example:
Inputs: DayShift(0), BarsSince(84);
If date crosses over calcdate(1210228, Dayshift) then sellshort next bar at market;
If date crosses over calcdate(1200229, Dayshift) then sellshort next bar at market;
If date crosses over calcdate(1190228, Dayshift) then sellshort next bar at market;
If barssinceentry >= BarsSince then buytocover next bar market;
So, we've talked about the different ways that you can either use Peak Trading Research analysis or your own approach to find these seasonal trends, but what's the best way to trade seasonals?
How should you actually structure a trade?
Based on a lot of analysis and testing that we've run, the best way to structure a seasonal trade is to take whatever bullish or bearish move you expect to see based on your 10, 12, or 15 years of seasonal analysis - maybe it's a 5% move or a 10% move or a 15% move - and then take half of that as your stop loss.
So, if you're looking to make $5,000 on a short position in sugar, take $2,500 as your stop.
Now, a 2:1 risk-reward ratio may not seem that great. For example, if we were using a breakout strategy, we might use a 4:1 or a 5:1 risk-return ratio. But with seasonal trades, we really want to give the trade a wide berth. We want to give this trade a lot of room to work.
These are multi-week or multi-month trades. A lot of volatility can happen in the meantime before we finally realize that eventual seasonal pattern. From our experience, a 2:1 risk-reward ratio generally makes sense to think about structuring these trades.
Now, we've talked about examples for soybeans and sugar, but seasonals also work for energy markets, for metal markets, and interest rate markets.
To summarize:
Commodity markets have strong seasonal trends.
These trends exist because there are certain times when traders either add or remove a risk premium.
There are different ways to analyze those seasonal trends, either a big picture multi-week, multi-month view, or a more specific high hit rate window.
To structure a seasonal trade, something like a 2:1 risk-reward ratio tends to work best.
Thanks for reading and if you’d like a trial of our actionable commodity research - including our in-depth seasonal analysis - you can reach out for trial: Insight@PeakTradingResearch.com.