
Non-Commercial vs Managed Money Hedge Fund Traders
What's the difference between a non-commercial trader and a managed money trader?
At Peak Trading Research we get this question all the time.
If you're a professional agriculture trader, you know that hedge funds are the predominant price drivers in agriculture futures markets but maybe you're unclear on the differences between these two hedge fund categories.
Today, we're going to go through the differences between non-commercial and managed money traders and we’ll tell you which category we prefer for analysis and systematic trading.
Hedge funds are the dominant participants in agriculture markets.
We've talked about this in a previous article here. When hedge funds buy prices go up, when hedge funds sell prices go down. Understanding hedge fund positioning is important.
But the CFTC makes this a little confusing because they put out two different COT reports: a managed money position and a non-commercial position.
So what's the difference between a non-commercial trader and a managed money trader? And which one should you be looking at for your analysis and trading?
Before we jump into that, let's back up and look at all the categories within these two different reports.

Comparison of the 2 CFTC reports (Supplemental and Disaggregated)
If we look at the differences between the supplemental report and disaggregated report, one of the first things that jumps out to us is that the disaggregated report has an extra category.
All large speculators fall into the non-commercial report in the supplemental report, but large speculators are split up into two categories in the disaggregated report: managed money traders and other reportables.
This is the first reason that we prefer the non-commercial position to the managed money position. When you look at the non-commercial position, you have the confidence that you're looking at the position for all large speculators. When you look at managed money traders, you might be missing some important traders like family offices or Chinese speculators (other reportable traders). The non-commercial position quantifies the position for all large speculators.
The second reason that we prefer the non-commercial position to the managed money position is also just a function of our background and experience at Peak Trading Research. Dave Whitcomb, Head of Research, was an agriculture trader at Cargill for 12 years. Cargill is one of the world's largest commercial trading houses. It’s our experience that most commercial traders tend to reference the non-commercial position. Most hedge fund traders tend to reference the managed money position.
For example, if you were sitting in on a meeting at Cargill or ADM or Bunge, and you heard their head Corn trader say hedge funds are 200,000 contracts long Corn, it's very likely that that trader is referencing the non-commercial position *not* the managed money position.
So again, that second reason that we like the non-commercial position is that it's more often referenced by the world's largest commercial traders.
And finally, the third reason that we prefer the non-commercial position to the managed money position is that we prefer the supplemental report overall in the way that the categories are defined versus the disaggregated report. As we discussed earlier, the disaggregated report has two different categories for large speculators: managed money traders and other reportable traders.
And then there's the swap dealer category, which is just a mess. The swap category has non-commercial swaps, commercial swaps, and index swaps. It isn't as clean as the index category in the supplemental report. So, because we like the categories in the supplemental report more than the categories and the disaggregated report, it follows that we prefer the non-commercial position.
To review the three reasons why we prefer non-commercial versus managed money positions:
#1: The non-commercial position quantifies the positioning for *all* large speculators. The managed money category does not do that…it misses important ‘other reportable’ category traders.
#2: Large commercial trading houses like Cargill and ADM and Bunge usually reference the non-commercial position, not the managed money position.
#3: Categories are better defined in the supplemental report, which includes non-commercial traders.
Now, the one big advantage of the managed money position in the disaggregated report is that it covers more markets. If you're a trader in the Spring Wheat market or Oats or Canola or White Sugar or Robusta Coffee, you unfortunately only have a managed money position. You don't have a non-commercial position reported by the CFTC for your market.

Now, as we wrap up, there's one thing we want to emphasize, and that is if you're using the non-commercial position or the managed money position to build systematic trading strategies, you are doing the right thing.
You should not, for example, be trying to build trading systems around the index position or the commercial position or the garbage swap category. The non-commercial position and the managed money position are always the categories that will give you the best signals for your trading.

And as much as we've highlighted the differences between these two categories, they actually move in a very similar way. For example, if we look at the last 10 years, the correlation between the non-commercial position and managed money position in Corn is 0.90, in Wheat it's 0.92, in Soybeans it's 0.98! As much as we've highlighted a lot of differences between the non-commercial and managed money categories, they really do move together.
At Peak Trading Research we use machine learning to provide our clients with daily live estimates for non-commercial and managed money positions across all agriculture, energy, and metals markets.
If you'd like a trial of our research, you can reach out any time, insight@peaktradingresearch.com.

How to Build Profitable COT Trading Systems
Take a look at 3 systematic trading strategies in the Oats, Live Cattle and Kansas Wheat markets that have shown profitable equity curves. Learn about the basics of the code behind these systems so you can start making more profitable trades.
COT positioning reports can give you an edge and make you a better, more profitable trader.
Today, we're going to be going through three specific examples of profitable trading systems that you can trade, all of which incorporate COT positioning data.
This is the third article in a set of three.
In our first article, we talked about COT report 101. What is the report? Why does it matter?
In the second article, we talked about commodity market participants, with a focus on hedge funds.
And now in this third article, we're going to tie everything together.
This is the fun stuff.
We're going to be talking about how you can build real systematic trading strategies based on COT data, based on what we talked about in the first two articles.
Today, we're going to be going through specific trading systems for three different agriculture commodity markets:
Oats
Live Cattle
Kansas Wheat
All three of these trading systems use a pretty similar big picture idea:
Sometimes hedge funds get too long and sometimes hedge funds get too short.
We're going to be building systems that take advantage of either short squeezes or long liquidation events.
We’ll be going through these examples in TradeStation using TradeStation EasyLanguage, but if you're a discretionary trader, if you want to do this in Excel, or you want to build it in Python, that's no problem. We’ll use TradeStation so we can look at some basic profit statistics. But, most importantly, let's focus more on the logic of the systems and less on the specific code itself.
THRESHOLD TRADING
Now for this first trading system, we're going to be going through a very basic example of what we call COT threshold trading. We'll use Oats as an example. The questions we’ll be asking: Is the hedge fund net position above a certain threshold? Are hedge funds too long and vulnerable to a liquidation event?
We can build a very simple trading system using just two lines of logic that says whenever that non-commercial net position is above 2,200 contracts, i.e., when hedge funds are extended long, then we want to sell short Oat futures the next day on the market open. And after 21 days have gone by (about a month), we want to exit that short position.

Sample oat strategy with 2 lines of logic
Now, if we look at the strategy performance report, that's a nice upward sloping equity curve, meaning this strategy has generally made positive cumulative profits over time. We can see that it's made money in 12 out of 18 trades over the past few years.
This shows promise using a very simple approach that we could trade the Oats market using that non-commercial position as a threshold to establish shorts.

Equity curve line for sample Oat trading strategy
BIG FLOWS
Now for our second trading system example, we're going to be talking about big hedge fund flows.
Sometimes weekly COT reports show that hedge funds bought or sold a large number of contracts, and often that can send important forward-looking price signals about that market.
Let's look at an example for the Live Cattle market.
If we look at data from the August 24th, 2021 COT report, we can see that non-commercial hedge fund traders added 14,760 contracts of new longs during the week. That's the third-largest inflow week on record.
Now, if we look at the other 20 largest inflow weeks since 2006, we can see that Live Cattle prices generally drop during the one-month and three-month periods that follow.

live cattle market showing price changes after long inflows
Another way to say this is hedge funds tend to be “long and wrong” when they buy a lot of Cattle futures.
Hedge funds buy live cattle futures, prices go up, the market runs out of buyers, prices naturally settle back in the one- and three-month periods after.
We can see that happened in real-time. After we sent this note to clients on August 28th, 2021, if we look at what live cattle futures have done…they’ve settled lower, as predicted.

Live cattle market
THRESHOLD TRADING + PRICE SIGNAL
Now for our third and final trading system, we're going to be using the same threshold idea that we talked about in the first trading system, but also incorporating a price signal to trade.
Threshold trading is great. It's easy to understand, but it has one big shortcoming and that is hedge funds can stay extended long or extended short for long periods of time. It often takes some catalyst, some fundamental or non-fundamental trigger that moves prices against hedge fund positioning and drives all these funds to liquidate their big positions at the same time. We're going to build a trading system that uses this price trigger idea to trade profitably.
Now let's take the same code that we used in the first example for the Oats market, and let's apply it to Kansas Wheat. So in this case, if the non-commercial net position is above a 2,000-contract threshold, then sell short Kansas Wheat next bar at market.

kansas wheat sample strategy
We can see if we look at the strategy performance report, this is a decent trading approach - we've got a nice upward sloping equity curve.
This approach would've made $30,500 over the last 10 years using this approach. Not bad.

Kansas wheat equity curve
Now we can improve this a little bit.
We can also layer on a price signal.
Instead of only using a COT position threshold, we’re going to use a threshold PLUS a price signal of a two-day-low stop. So the system will sell short only if prices break through the lowest level of the past two trading sessions.

Kansas wheat sample strategy with price signal
Whenever momentum starts turning lower, this system is then going to sell instead of just selling above that threshold. Now, if we look at our strategy performance report, it's gotten a little bit better. Our P&L has improved.
Our profit line looks better. More profits, fewer drawdowns.

Kansas wheat equity curve with price signal
Now in both the Oats system in the first example and the Kansas Wheat system in the third example, we talked about selling short when hedge funds are extended long.
But there are, of course, other ways that you can trade COT data:
You could add more price filters to some of these systems or a seasonal filter or volume or momentum.
You could also incorporate positions from some of the other market participants we talked about in our second video: other reportables, non-reportables, commercial positioning.
There's a lot more you can do here.
If you are looking for more ideas on how to build trading systems around COT data, these are fantastic resources:
The Commitment of Traders Bible by Stephen Briese
Trade Stocks and Commodities with the Insiders by Larry Williams.
Hopefully this article gave you a good sense for how you can build profitable trading systems using COT data.
Any questions? insight@peaktradingresearch.com

COT Market Participants (Hedge Funds Matter!)
Today we're going to be talking about commodity market participants and why hedge funds matter so much for commodity markets. To get started, let's look at the big picture and talk about the four main participants in commodity markets.
That's hedge funds, index funds, commercial traders, and smaller private traders.
Hedge funds really matter for commodity markets.
When hedge funds buy, prices go up and when hedge funds sell prices, go down.
Today we'll talk about who these hedge funds are, how they trade, and how we can see the influence that these funds have on commodity markets in the weekly Commitment of Traders reports.
We'll also talk about some other important investor categories: index funds, commercial traders, small private traders, and how they all interact with one another to exert influence over commodity market prices.
To get started, let's look at the big picture and talk about the four main participants in commodity markets.
That's hedge funds, index funds, commercial traders, and smaller private traders.
HEDGE FUNDS
Let's start with hedge funds. You probably know what a hedge fund is. It's an investment fund that is trying to make money for its clients by speculating. For commodity futures, a hedge fund is trying to either buy or sell short commodity futures with the goal of making a profit for its clients.
Rhere are a lot of different hedge funds that use a lot of different information and price drivers to trade but broadly speaking, they fall into three main buckets:
Systematic traders
Fundamental traders
Macro traders
Systems traders are mostly using some combination of technical or momentum signals to trade.
Fundamental traders are using balance sheets, e.g., how much of a crop is grown, how much it's harvested, how much demand there is.
Macro traders are taking big-picture thematic views, for example, a view on the dollar or a view on inflation and expressing that via commodity futures.
There's been an important trend in the last 10 years and that is hedge funds are focusing more and more on non-nonfundamental trading inputs (momentum, seasonality, macro flows) and less on fundamental trading inputs (yields, production, demand).
Who are some of the big systematic hedge funds in commodity markets?
It's groups like Millennium, Winton, Two Sigma, Systematica, and Square Point.
And some of the fundamentally-biased hedge funds like Citadel or DE Shaw are using a ‘quantamentals’ approach to trade. They're blending quant style trading with fundamental inputs that they can backtest.
Now, how do we know that hedge funds have so much influence in commodity markets?
If we look at weekly CFTC Commitment of Trader report money flows, we can see that there's a positive correlation between the money that hedge funds are putting into or out of commodity markets and what prices do during the week. If hedge funds buy, prices go up. If hedge funds sell, prices go down.
Now let's take an example from a big liquid agriculture market like corn.
If we take the correlation between hedge fund flows and prices, we can see that they are strongly positively correlated. Meaning again, when hedge funds buy, prices go up.
We can see that mathematically, we can prove that out. And this is the same for most commodity markets.
Hedge funds are the price drivers for commodity markets.

POSITIVE CORRELATION SHOWING HEDGE FUNDS AS PRICE DRIVERS
In our third article on Commitment of Traders reports, we’ll talk more about building real systematic trading systems around COT data. We’ll give real examples of how we can use hedge fund positioning to inform profitable trading decisions in real-time.
INDEX FUNDS
Let's move on to index funds.
Index funds invest in commodities as a hedge against future inflation. They're using commodity futures as a store of value. Examples of index fund investors: pension funds, endowments, foundations, and sovereign wealth funds. These groups have a big pool of assets that they need to protect against the threat of inflation.

POPULAR COMMODITY INDEX FUNDS
These index investors will invest in a commodity index, a popular index like the Bloomberg Commodity Index or the Goldman Sachs Commodity Index, where the goal is to just hold a big bucket of commodities, e.g., crude oil, gold, copper, silver, corn, wheat, soybeans, cattle, and cocoa.
They just want exposure to the whole commodity asset class so that if prices start rising, they know that they have a hedge against inflation.
As you might have guessed, the number one trading input that index investors use when deciding to put money into or out of commodity markets is future inflation expectations.
If they think inflation's going to run hot over the near term, they're going to put more money into commodities as a hedge against future price rises.
What are some examples of index investors?
California Public Employee Retirement System
Harvard Endowment
Abu Dhabi Investment Authority
These are investors that are investing for multiple quarters or even multiple years.
They're long-term, slow-moving investors.
COMMERCIAL TRADING HOUSES
Now the third category is the commercial or producer category.
These are big commercial trading houses like the ABCDs: ADM, Bungee, Cargill, and Louis Dreyfus.
Commercial trading houses are generally price takers in commodity markets. Remember, we talked about hedge funds being the price drivers, commercial trading houses are usually the price takers.
Now, this does *not* mean that commercial traders are uninformed or slow. What it does mean is that they usually have cash positions against their future trades. These producers might view futures as expensive or cheap basis cash and they're more willing to take the other side of the trade that hedge funds have on.
If we look at the correlation between weekly producer and commercial flows and price changes, we can see this relationship: there's a strong negative correlation in a market like corn. When producers buy or sell, it doesn't have the same positive correlation as hedge funds.
Producers are the price takers.

Negative CORRELATION SHOWING index FUNDS AS PRICE takers
SMALL PRIVATE TRADERS
Now let's talk about this final category, the fourth category, that's small prop shops.
In the disaggregated COT report, there's this category called other reportables.
Other reportables are a mix of groups that trade a significant number of contracts but they're not managing money for other groups…they're managing their own money.
Other reportables are:
Option locals
Family offices
Chinese speculators
And finally, there are non-reportable traders.
Non-reportable traders hold a small enough position in commodity futures that they fall below the CFTC's reporting requirements.
Here is where you can find what exactly these limits are for each market (scroll to section 15.03):
The CFTC is trying to ensure the orderly functioning of markets. The CFTC doesn't want a few big players colluding to run markets up and down and squeeze everyone out.
If you’re a small trader and you hold five contracts of corn or ten contracts of crude oil, the CFTC isn't too worried about you running markets or causing any disruptions…they just don't need to hear from you so they put you in the non-reportable category.
To helps clarify things a bit, here are some of the differences between how investors are mapped between the two different COT reports (Disaggregated and Supplemental):
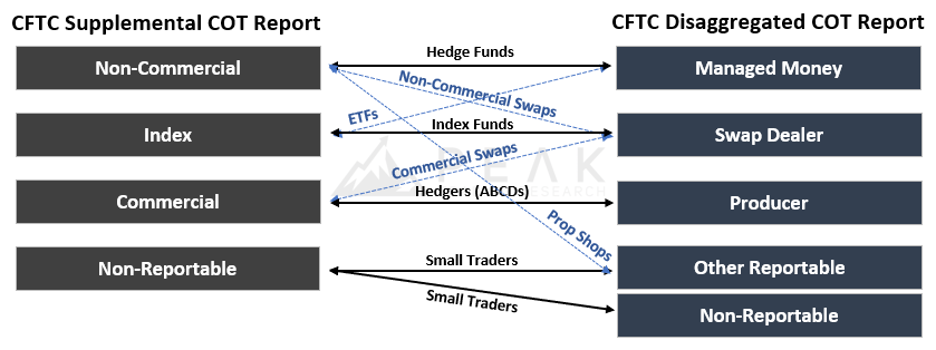
CFTC REPORT COMPARISON: SUPPLEMENTAL VS. DISAGGREGATED
Before you get too confused, remember to focus on the big picture:
Hedge funds are the price drivers in commodity markets.
Now for some markets, index funds can matter a little bit more or other reportable traders can matter a little bit more but by and large, keep in mind that hedge funds are the price drivers.
That is the group that you really need to focus on.
We'll come back to this idea a lot in our third article, where we talk about building real systematic trading systems around COT data and specifically around hedge fund position.
Peak Trading Research is the only research company that provides its clients with quarterly updates of correlations between price changes and weekly COT money flow so you can always see the evolution of which category matters most in your trading.

CORRELATIONS BY MARKET
As always, if you're interested in a trial of our actionable commodity research, you can reach out, insight@peaktradingresearch.com.

COT 101: What is the Weekly COT Report? Why Does It Matter for Profitable Commodity Trading?
Whether you are new to trading or an expert commodities trader, this video helps you understand and use the Commitment of Traders (COT) report in your daily analysis and trading. And most importantly, learn how to incorporate COT data into your systematic trading strategies.
Weekly Commitment of Traders (COT) reports are great. They can provide really valuable forward-looking information that can help you trade more profitably. Let’s talk about what the weekly Commitment of Traders report is, why it matters, and how it can make you a better trader.
To start: When are these COT reports published? They're published every Friday, with the exception of holidays. And, once in a while, there's a US Government shutdown - then the reports are delayed by a few days or weeks. Usually, they're reported every Friday.
But there’s a twist: COT data published on Friday is gathered as of the previous Tuesday. So the data is always delayed by at least three days. And by the time you get into the next week, that data becomes four, five, six, seven days delayed.
So, COT data is not published every day. It's not live. It’s always delayed by at least three days.
On the CFTC site (below), you'll find all the different COT reports listed by year. You can either use code, e.g., Python, to scrape the site, or you can simply download the reports as Excel (.csv) files for your analysis. A second option for finding COT data is to access it via a trading platform like Bloomberg or Reuters or TradeStation.
You can visit this site to view and download historical COT data.

CFTC website where you can access to the COT report each week
COT reports are especially valuable for agriculture futures - less so for energy or metal markets.
Why is that?
It's because most of the volume that's traded in agriculture markets is done via futures. The CFTC sees all that future's trading volume on its exchanges, and it says, "Okay, we can report that. We can quantify that and wrap our arms around that."
For energy and metals, there's a lot of trading volume that's done OTC (over the counter).
So COT data isn't quite as valuable for energy and metals as it is for agriculture markets.
Now without complicating things too much, there are actually two COT reports that you need to know about:
The Supplemental report: Agriculture specific. It has 13 agriculture markets.
The Disaggregated report: 150 different markets, including all major agriculture, energy, and metal markets.

The 13 agriculture markets covered in the COT Supplemental report
We'll do a deeper dive into the differences between the two COT reports and those market participants when we talk more about commodity market participants.
So what have we established?
The COT report is a weekly report.
It's always delayed by at least a few days.
It's pretty easy to find (website here).
It shows you positioning details across some important investor categories:
Hedge funds
Commercial traders
Index funds
Small private traders
Now, you might be saying, "Okay, that's great. How can I use this report to trade? How can I use the data that's in the COT report to make profitable trading decisions?"
You can find out more about building real systematic trading systems using COT data in the article here - but at a very high level, this is how you should think about trading COT data:
Imagine sitting down at a poker table and you can see most of your opponent’s cards. You can see what the other players hold. You don't know everything that they hold, but you have some very important clues about if they have a good hand or a bad hand.
That's how the CFTC COT report works.

You know that hedge funds are extended really long, or they're extended really short, or maybe index funds are extended really long, or they're extended really short, and you can see how vulnerable those positions are.
We're going to build some trading systems in our third article on COT reports around that idea.
Are hedge funds too long and vulnerable to a long liquidation?
Or are they too short and they're vulnerable to a short squeeze?
This COT information is tradeable. You can read more here.
Peak Trading Research is the only company that provides clients with daily estimates of COT hedge fund positions across all energy, metals, and agriculture markets.
If you're interested in a trial of our research, you can reach out to us at insight@peaktradingresearch.com.